Documentation index: llms.txt. This page is also available as markdown: append .md to this URL or send Accept: text/markdown.
Build a Metrics Engine for Site Cost Reporting
Introduction
Monthly site cost reporting often depends on hundreds of KPIs with layered formulas, manual adjustments, and a flat table that an existing BI semantic model already expects. Hard-coding every formula in one SQL script does not scale when formulas change, dependencies deepen, or finance needs an auditable adjustment trail.
This guide shows how to model that pattern in Coalesce on Databricks: input values at a consistent grain, a KPI catalog that stores formula and dependency metadata, an engine Node that calculates KPI values in SQL, joins the catalog to apply adjustments only where allowed, and a flat presentation table for BI.
When Catalog-Driven Metrics Help
A catalog-driven metrics engine is a strong fit when:
- Many KPIs share the same grain, for example period, site, and location, and you want formula and dependency metadata stored as data for governance.
- Formulas change over time and you want to update metadata instead of rewriting dozens of Nodes.
- Manual adjustments must be auditable and must not replace the engine formula output.
- Downstream BI still expects a flat table even if the engine stores metrics in long form.
Prefer simpler Stage or Fact Nodes with fixed SQL when you only have a handful of stable metrics and no adjustment workflow.
How Coalesce Models This
Keep these layers separate:
- Inputs - values extracted from source systems at engine grain.
- KPI catalog - formula definitions, dependency edges, and whether each KPI is adjustable as data.
- Adjustments - optional deltas from an adjustments application.
- Engine output - long-form KPI values with both engine and final amounts.
- Presentation - reshape for the existing BI model.
This guide calculates KPI math in SQL that mirrors the catalog formulas. Production engines often evaluate formula_expr dynamically in dependency order. Here the catalog still drives which KPIs exist and which ones may receive adjustments.
Avoiding Common Mistakes
Keep these constraints in mind as you build:
- Do not overwrite formula results with adjusted values only. Always retain
engine_valueand applyadjustment_delta. - Do not put a top-level
WITHas the entire Join string. Wrap CTEs inFROM ( … ) src.
What You Will Build
When you finish this guide, you will have:
- 3 Sources:
store_sales,date_dim, andstore stg_input_valueswith long-formIN_SALES,IN_UNITS, andIN_COGSby store and monthref_kpi_catalogwith 4 sample KPIs, formulas, dependency metadata, and whether each KPI is adjustableref_adjustmentswith synthetic adjustment deltas for an adjustable KPIfct_kpi_valueswithengine_value,adjustment_delta, andfinal_valuefct_kpi_bi_flatwith one column per KPI for BI-style consumption
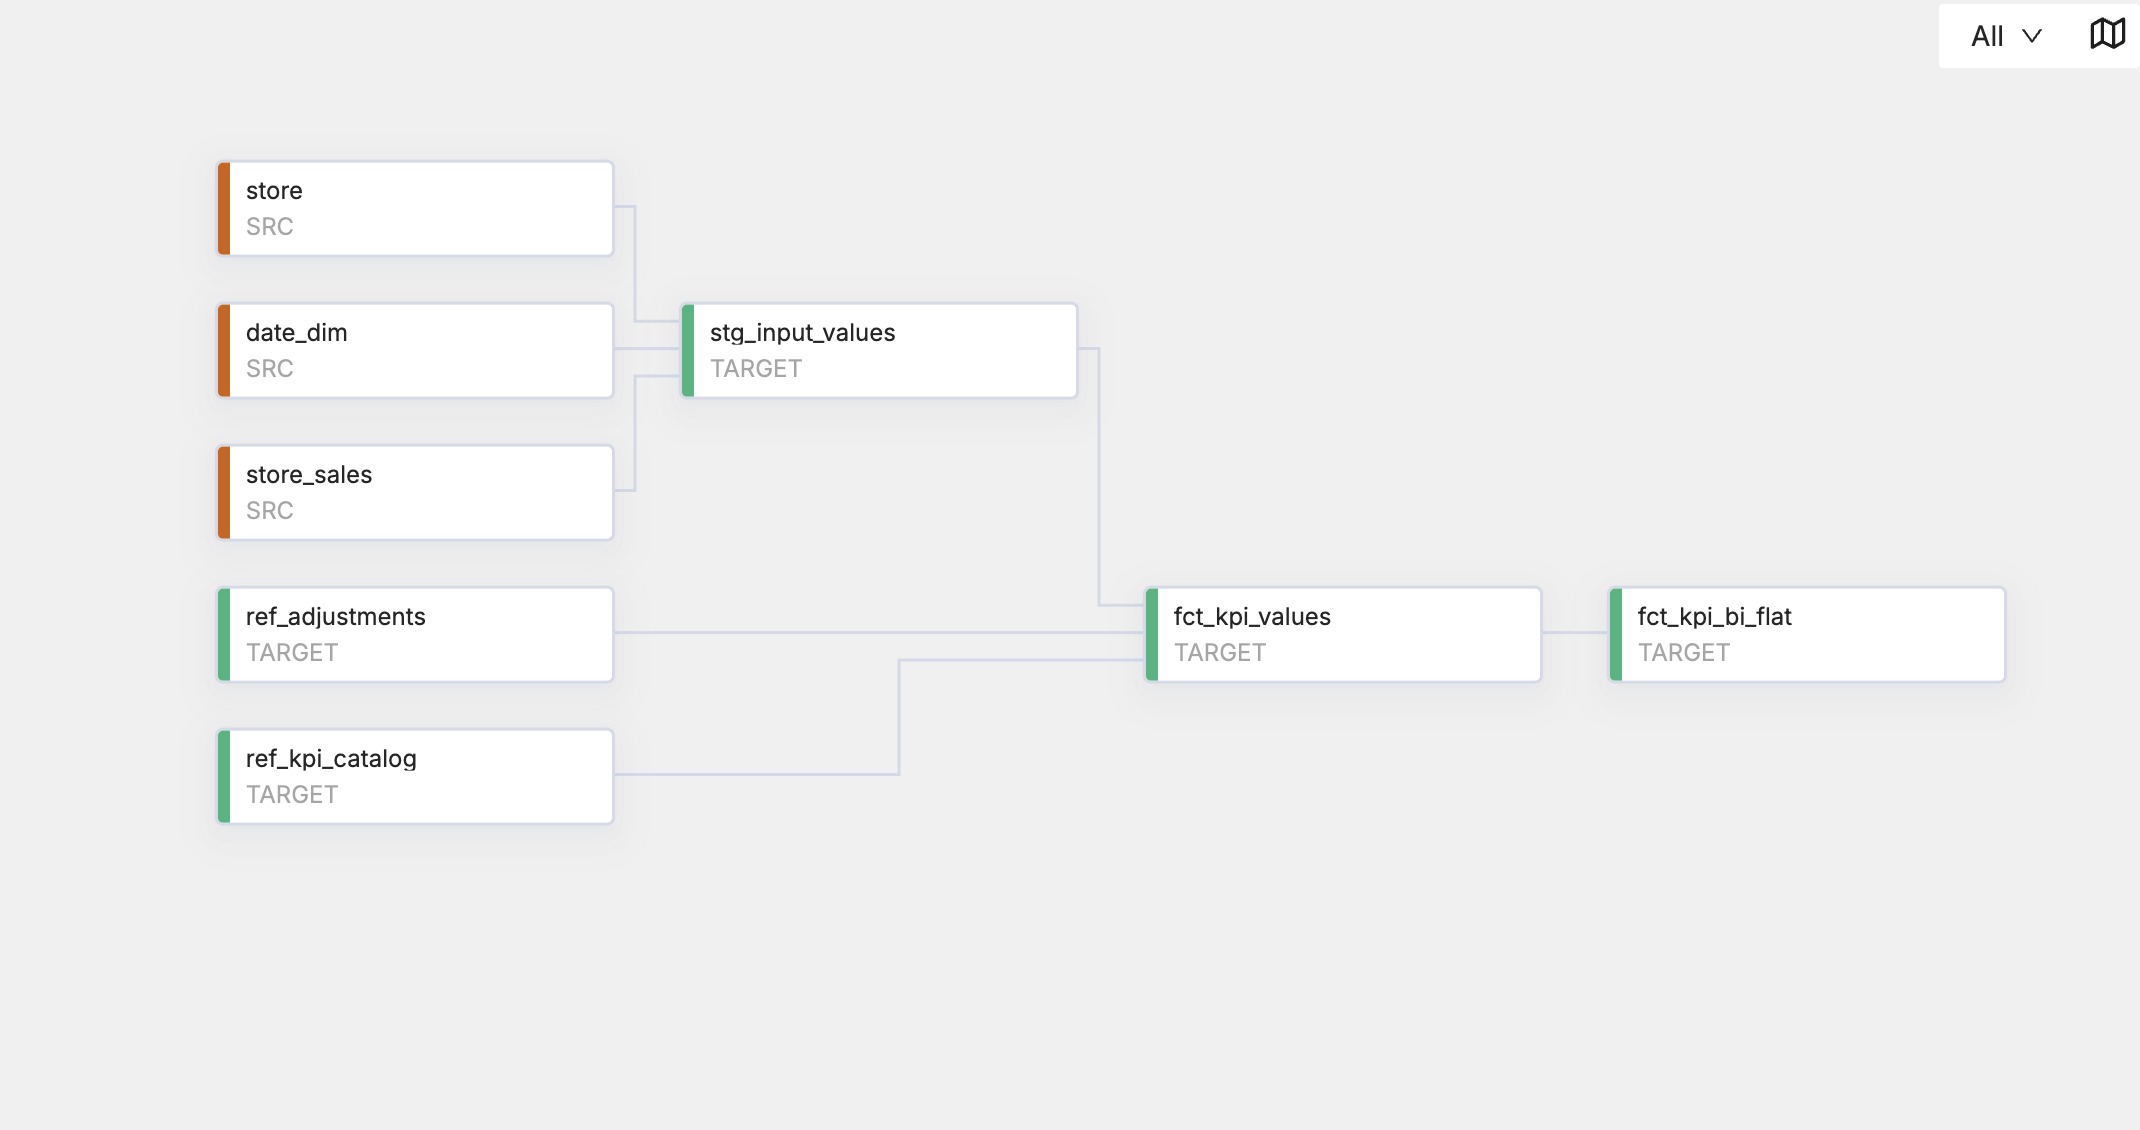
How the Pipeline Fits Together
| Node | Node Type | What it does |
|---|---|---|
store_sales, date_dim, store | Source | TPC-DS facts and dimensions that supply raw sales, costs, and store attributes. |
stg_input_values | Stage | Aggregates year 2001 store sales by month and produces 3 long-form input metrics. |
ref_kpi_catalog | Stage | Seeds KPI ids, formula text, depends_on edges, and is_adjustable. The engine joins this table so only adjustable KPIs accept deltas. |
ref_adjustments | Stage | Seeds manual adjustment deltas keyed by KPI, month, and site. |
fct_kpi_values | Stage | Pivots inputs, calculates KPIs in SQL, joins the catalog and adjustments, and sets final_value = engine_value + adjustment_delta. |
fct_kpi_bi_flat | Stage | Pivots KPI final values into 1 wide row per site and month for BI. |
This lab uses Stage Nodes for every layer so you can focus on the Join and Mapping pattern. In production, review Choosing the Right Node for Fact, View, Dimension, Work, and platform Base or Functional Node Types that may fit inputs, facts, and presentation tables better.
Before You Begin
- A Coalesce account with a Databricks connection configured. See the Databricks Connection Guide.
- A Project and Workspace you have edit permissions on.
- Access to Unity Catalog
samples.tpcds_sf1, which is included in Unity Catalog-enabled Databricks workspaces. - Storage Locations for SRC, mapped to the sample catalog, and TARGET, mapped to a writable schema such as your development schema.
- This guide uses Databricks Unity Catalog sample data in
samples.tpcds_sf1as a stand-in for operational source systems. Store locations play the role of sites.
Step 1: Add TPC-DS Sources
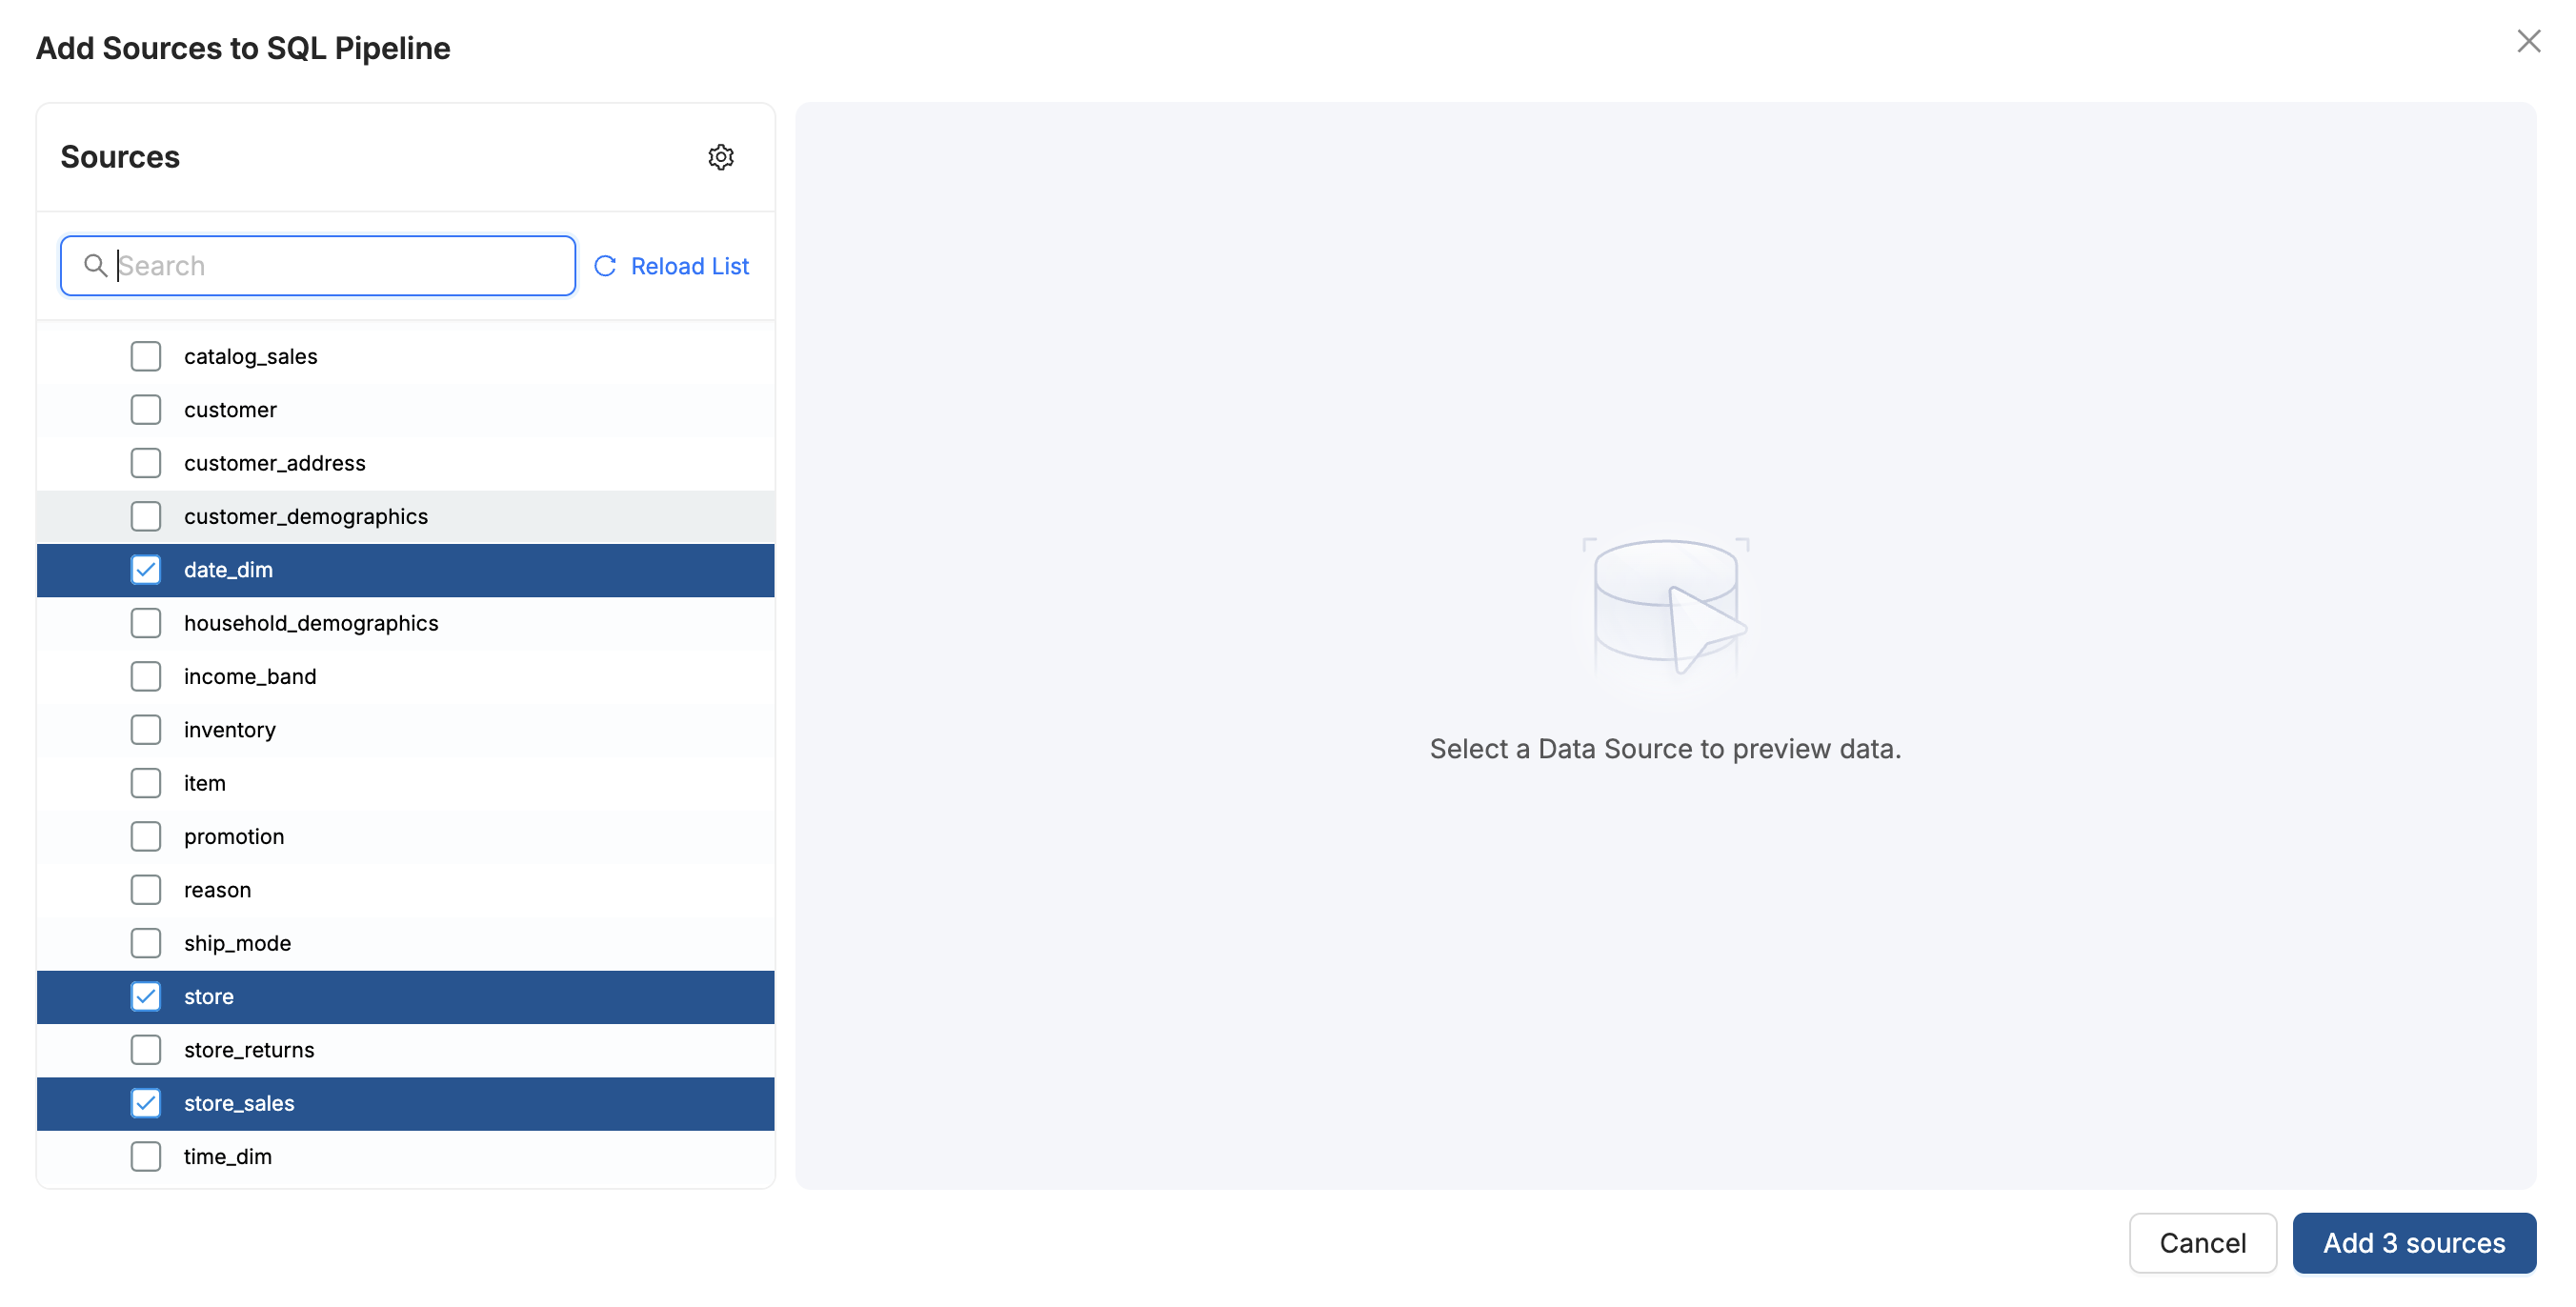
Add the 3 TPC-DS tables that supply sales, dates, and store attributes.
- In your Workspace, click the + control next to the Nodes search box.
- Choose Add Sources.
- Select only these tables from
samples.tpcds_sf1:store_salesdate_dimstore
- Click Add 3 sources so the Sources appear on the graph.
Step 2: Build Input Values
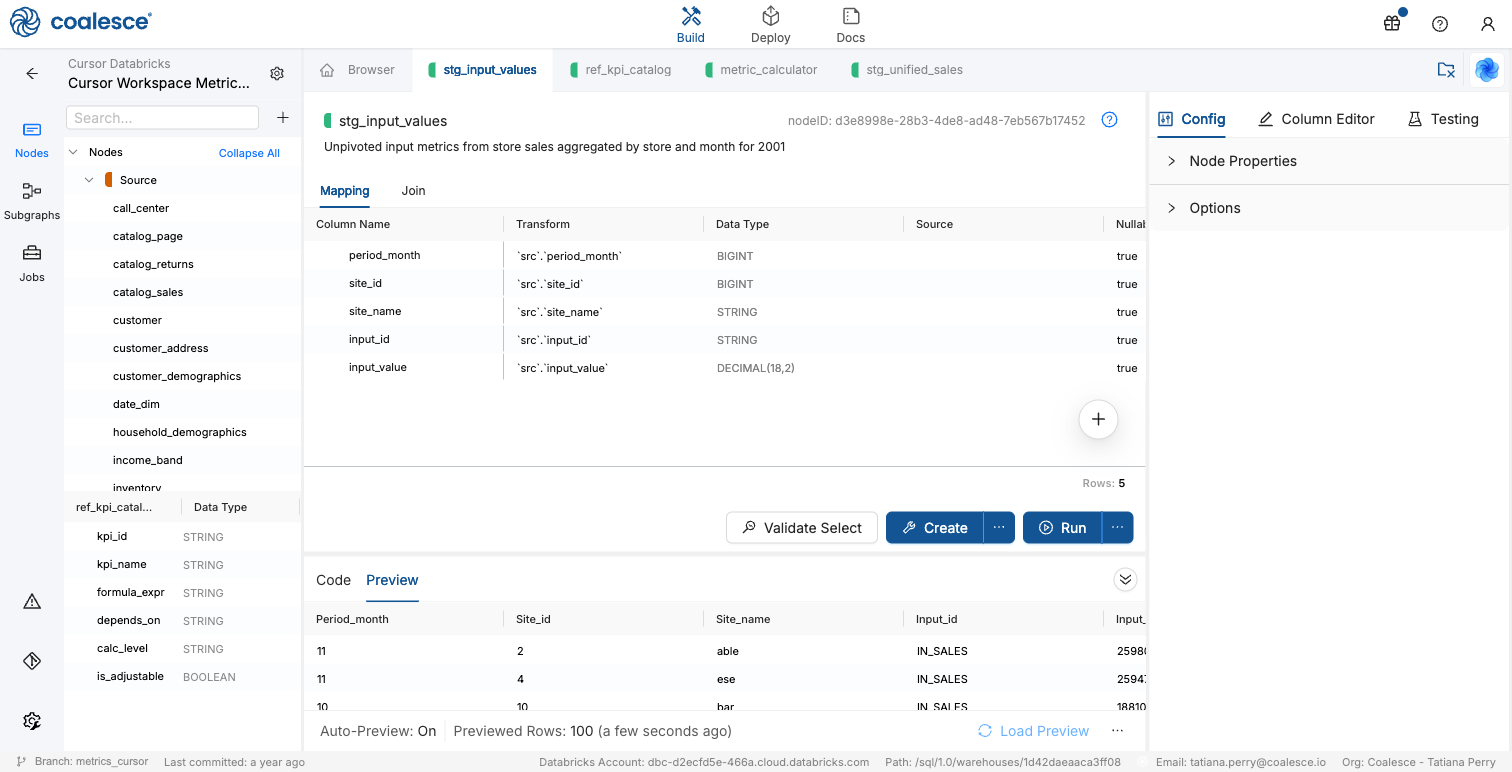
Create a Stage Node that aggregates 2001 store sales by month and reshapes sales, units, and COGS into long-form input rows.
-
In Browser, click the + control next to the Nodes search box.
-
Choose Add Node > Stage.
-
Name the Node
stg_input_valuesand set its Storage Location to TARGET. -
Set the Node description to
Unpivoted input metrics from store sales aggregated by store and month for 2001. -
On the Join tab, paste:
FROM (WITH base_agg AS (SELECTdate_dim.d_moy AS period_month,store.s_store_sk AS site_id,store.s_store_name AS site_name,SUM(store_sales.ss_ext_sales_price) AS agg_sales,SUM(store_sales.ss_quantity) AS agg_units,SUM(store_sales.ss_ext_wholesale_cost) AS agg_cogsFROM {{ ref('SRC', 'store_sales') }} store_salesINNER JOIN {{ ref('SRC', 'date_dim') }} date_dimON store_sales.ss_sold_date_sk = date_dim.d_date_skINNER JOIN {{ ref('SRC', 'store') }} storeON store_sales.ss_store_sk = store.s_store_skWHERE date_dim.d_year = 2001GROUP BY date_dim.d_moy, store.s_store_sk, store.s_store_name)SELECT period_month, site_id, site_name, CAST('IN_SALES' AS STRING) AS input_id,CAST(agg_sales AS DECIMAL(18,2)) AS input_value FROM base_aggUNION ALLSELECT period_month, site_id, site_name, CAST('IN_UNITS' AS STRING) AS input_id,CAST(agg_units AS DECIMAL(18,2)) AS input_value FROM base_aggUNION ALLSELECT period_month, site_id, site_name, CAST('IN_COGS' AS STRING) AS input_id,CAST(agg_cogs AS DECIMAL(18,2)) AS input_value FROM base_agg) srcWhat does
stg_input_valuesdo?This Join builds
stg_input_values: 1 row per input metric, store, and month for 2001.base_aggaggregates TPC-DSstore_salesby month and store into 3 measures: sales, units, and COGS.UNION ALLreshapes those 3 columns into long form: each measure becomes a row withinput_idset toIN_SALES,IN_UNITS, orIN_COGS, plusinput_value.FROM ( … ) srcwraps the CTE so Coalesce can treat it as a Join source, as inSELECT … FROM ( … ) src.
-
On the Mapping tab, make sure the columns are mapped to the following:
src.period_month-BIGINTsrc.site_id-BIGINTsrc.site_name-STRINGsrc.input_id-STRINGsrc.input_value-DECIMAL(18,2)
-
Click Create. Confirm the Node creates successfully.
-
Click Run. Confirm the run succeeds.
-
Open Preview and confirm long-form rows for
IN_SALES,IN_UNITS, andIN_COGS.
Step 3: Seed the KPI Catalog
Create a Stage Node that seeds KPI definitions, formulas, dependencies, and whether each KPI is adjustable as data.
-
In Browser, click the + control next to the Nodes search box.
-
Choose Add Node > Stage.
-
Name the Node
ref_kpi_catalogand set its Storage Location to TARGET. -
Set the Node description to
KPI catalog defining calculation formulas, dependencies, and whether each KPI is adjustable. -
On the Join tab, paste:
FROM (SELECT 'KPI_GROSS_MARGIN' AS kpi_id, 'Gross Margin' AS kpi_name,'IN_SALES - IN_COGS' AS formula_expr, 'IN_SALES,IN_COGS' AS depends_on,'input' AS calc_level, FALSE AS is_adjustableUNION ALLSELECT 'KPI_ASP', 'Average Selling Price','IN_SALES / NULLIF(IN_UNITS, 0)', 'IN_SALES,IN_UNITS','input', FALSEUNION ALLSELECT 'KPI_MARGIN_PCT', 'Margin Percentage','(KPI_GROSS_MARGIN / NULLIF(IN_SALES, 0)) * 100', 'KPI_GROSS_MARGIN,IN_SALES','derived', FALSEUNION ALLSELECT 'KPI_CONTRIBUTION', 'Contribution to Total','KPI_GROSS_MARGIN', 'KPI_GROSS_MARGIN','derived', TRUE) srcWhat does
ref_kpi_catalogdo?This Join seeds
ref_kpi_catalog: 1 row per KPI definition, built from hard-codedUNION ALLselects.- Each
SELECTdefines a KPI:kpi_id, display name,formula_expr, comma-separateddepends_oninputs or KPIs,calc_levelasinputorderived, andis_adjustable. UNION ALLstacks the 4 sample KPIs into 1 result set: gross margin and ASP from inputs, then margin percentage and contribution from derived KPIs.FROM ( … ) srcwraps the seed so Coalesce can treat it as a Join source.
ref_kpi_catalogandref_adjustmentsare built from hard-codedUNION ALLrows in the Join. In production, you can load them from an application or admin process instead. They do not readstore_sales,date_dim, orstore, so the graph correctly shows no upstream Sources. Their outgoing lines go intofct_kpi_values.How they get updates:
- In this guide - You change the seed SQL, then Create and Run those Nodes again. They do not refresh from warehouse Sources.
- Production use case - Update the catalog with manual Databricks changes or a formula UI. Load adjustments from the adjustments application, not from sales Sources.
Refresh
stg_input_valuesfrom Sources often. Refresh the refs when the catalog or adjustment feed changes, then re-runfct_kpi_valuesandfct_kpi_bi_flat. - Each
-
On the Mapping tab, make sure the columns are mapped to the following:
src.kpi_id-STRINGsrc.kpi_name-STRINGsrc.formula_expr-STRINGsrc.depends_on-STRINGsrc.calc_level-STRINGsrc.is_adjustable-BOOLEAN
-
Click Create. Confirm the Node creates successfully.
-
Click Run. Confirm the run succeeds.
-
Open Preview and confirm 4 catalog rows.
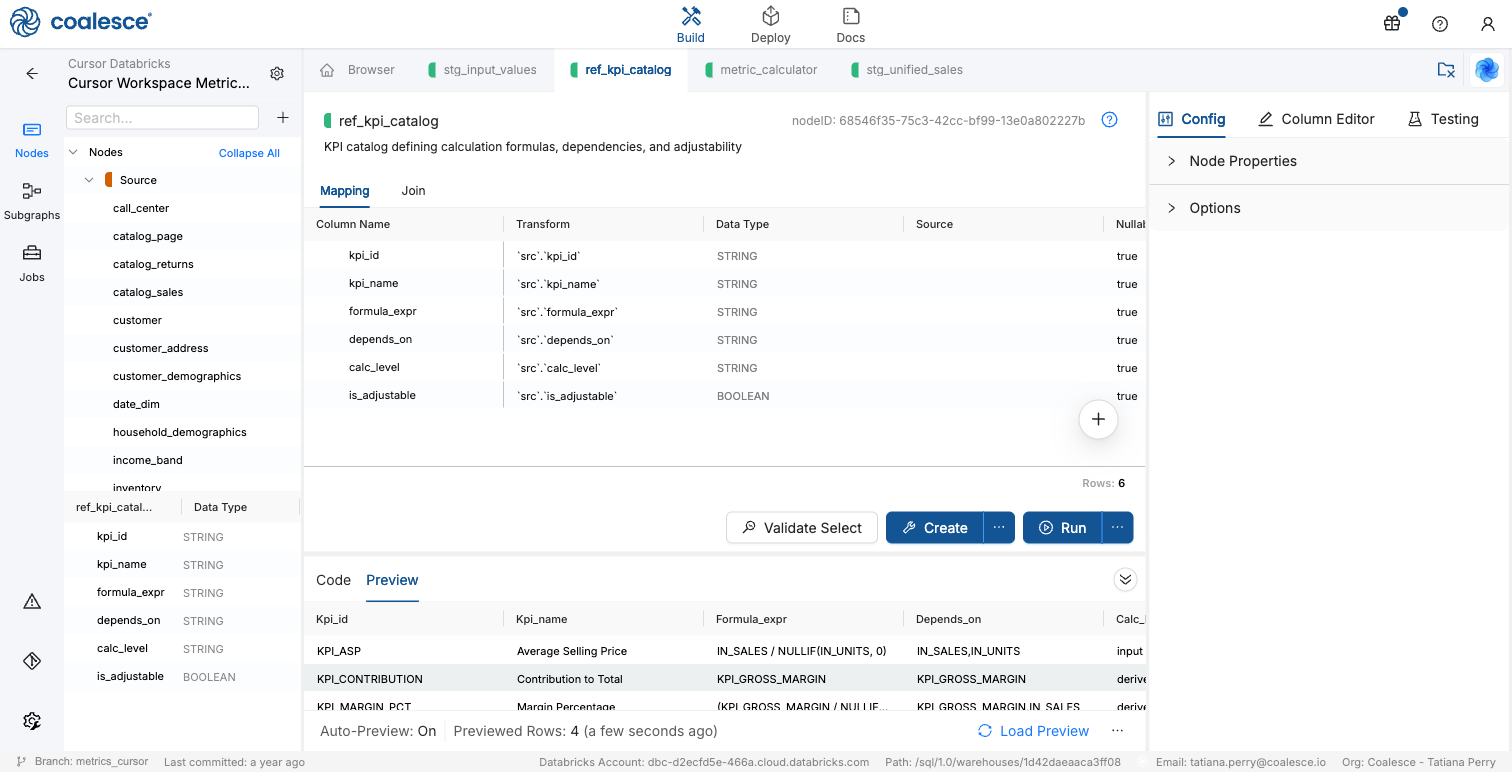
depends_on and formula_expr document the intended hierarchy for governance and for a future dynamic evaluator. In this guide, Step 5 implements matching math in SQL and joins the catalog so is_adjustable controls whether adjustment deltas apply.
Step 4: Seed Adjustments
Create a Stage Node with sample adjustment deltas for the adjustable KPI.
-
In Browser, click the + control next to the Nodes search box.
-
Choose Add Node > Stage.
-
Name the Node
ref_adjustmentsand set its Storage Location to TARGET. -
Set the Node description to
Manual adjustments for adjustable KPIs. -
On the Join tab, paste:
FROM (SELECT 'KPI_CONTRIBUTION' AS kpi_id, 1 AS period_month, 1 AS site_id,'Store A' AS site_name, 150.00 AS adjustment_delta,'Q1 promotional boost' AS adjustment_reasonUNION ALLSELECT 'KPI_CONTRIBUTION', 2, 1, 'Store A', -75.50, 'Inventory write-down'UNION ALLSELECT 'KPI_CONTRIBUTION', 3, 2, 'Store B', 200.00, 'New product launch'UNION ALLSELECT 'KPI_CONTRIBUTION', 1, 4, 'Store C', -50.00, 'Discount campaign') srcWhat does
ref_adjustmentsdo?This Join seeds
ref_adjustments: 1 row per manual delta for an adjustable KPI, site, and month, built from hard-codedUNION ALLselects.- Each
SELECTdefines an adjustment: whichkpi_idit applies to, theperiod_month,site_id, andsite_namegrain, a signedadjustment_delta, and anadjustment_reason. UNION ALLstacks the 4 sample adjustments into 1 result set. All rows targetKPI_CONTRIBUTION, the only adjustable KPI in the catalog.FROM ( … ) srcwraps the seed so Coalesce can treat it as a Join source.- Use
site_idvalues that appear instg_input_valuesfor year 2001. In this sample, those keys are1,2,4,7,8, and10. A seed row for a missingsite_idnever joins in Step 5.
- Each
-
On the Mapping tab, make sure the columns are mapped to the following:
src.kpi_id-STRINGsrc.period_month-BIGINTsrc.site_id-BIGINTsrc.site_name-STRINGsrc.adjustment_delta-DECIMAL(18,2)src.adjustment_reason-STRING
-
Click Create. Confirm the Node creates successfully.
-
Click Run. Confirm the run succeeds.
-
Open Preview and confirm 4 adjustment rows.
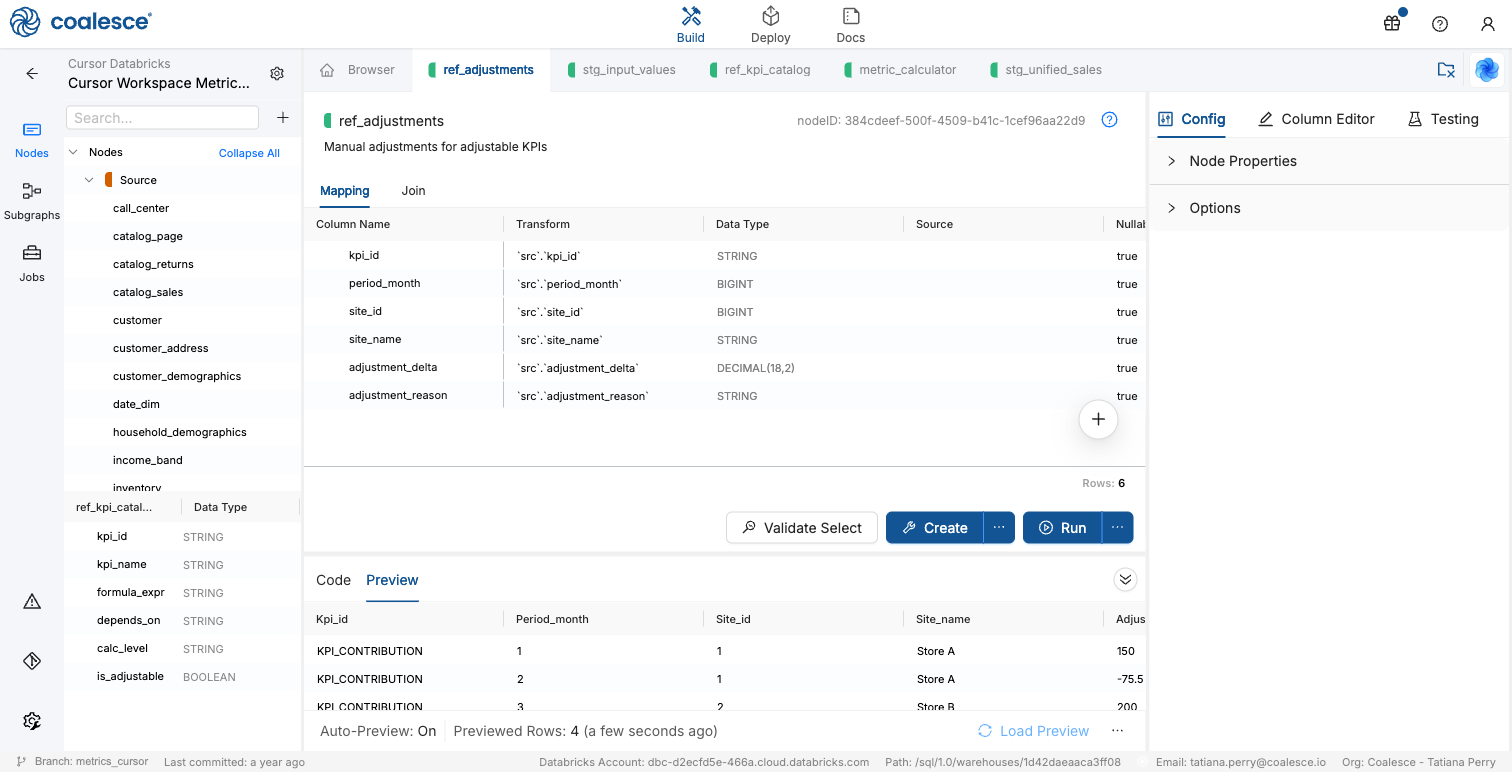
In production, load this table from your adjustments application. In this guide, synthetic rows prove the delta path on matching kpi_id, period_month, and site_id keys for adjustable KPIs. The site_name values in the seed, such as Store A, are labels only and are not join keys. Step 5 keeps site_name from stg_input_values, so preview names can differ from the seed labels.
Step 5: Calculate KPI Values
Create the engine Stage Node that pivots inputs, calculates each KPI in SQL, and applies adjustments only where the catalog allows them.
-
In Browser, right-click
stg_input_valuesand select Add Node > Stage. -
Name the Node
fct_kpi_valuesand set its Storage Location to TARGET. -
Set the Node description to
Calculated KPI values with engine-computed values plus manual adjustments. -
On the Join tab, paste:
FROM (WITH input_pivot AS (SELECTperiod_month,site_id,site_name,MAX(CASE WHEN input_id = 'IN_SALES' THEN input_value END) AS in_sales,MAX(CASE WHEN input_id = 'IN_UNITS' THEN input_value END) AS in_units,MAX(CASE WHEN input_id = 'IN_COGS' THEN input_value END) AS in_cogsFROM {{ ref('TARGET', 'stg_input_values') }} stg_input_valuesGROUP BY period_month, site_id, site_name),kpi_calc AS (SELECT'KPI_GROSS_MARGIN' AS kpi_id,period_month,site_id,site_name,in_sales - in_cogs AS engine_valueFROM input_pivotUNION ALLSELECT'KPI_ASP',period_month,site_id,site_name,in_sales / NULLIF(in_units, 0) AS engine_valueFROM input_pivotUNION ALLSELECT'KPI_MARGIN_PCT',period_month,site_id,site_name,((in_sales - in_cogs) / NULLIF(in_sales, 0)) * 100 AS engine_valueFROM input_pivotUNION ALLSELECT'KPI_CONTRIBUTION',period_month,site_id,site_name,in_sales - in_cogs AS engine_valueFROM input_pivot)SELECTkpi_calc.kpi_id,kpi_calc.period_month,kpi_calc.site_id,kpi_calc.site_name,kpi_calc.engine_value,CASEWHEN ref_kpi_catalog.is_adjustable THEN COALESCE(ref_adjustments.adjustment_delta, 0.0)ELSE 0.0END AS adjustment_delta,kpi_calc.engine_value + CASEWHEN ref_kpi_catalog.is_adjustable THEN COALESCE(ref_adjustments.adjustment_delta, 0.0)ELSE 0.0END AS final_valueFROM kpi_calcINNER JOIN {{ ref('TARGET', 'ref_kpi_catalog') }} ref_kpi_catalogON kpi_calc.kpi_id = ref_kpi_catalog.kpi_idLEFT JOIN {{ ref('TARGET', 'ref_adjustments') }} ref_adjustmentsON kpi_calc.kpi_id = ref_adjustments.kpi_idAND kpi_calc.period_month = ref_adjustments.period_monthAND kpi_calc.site_id = ref_adjustments.site_id) srcWhat does
fct_kpi_valuesdo?This Join builds
fct_kpi_values: 1 row per KPI, store, and month with engine-computed and final values.input_pivotpivots long-form inputs into wide columnsin_sales,in_units, andin_cogsper site and month.kpi_calccalculates each catalog KPI in SQL, mirroringformula_expr, and stacks the results withUNION ALL.- The outer
SELECTjoinsref_kpi_catalogandref_adjustments, applies deltas only whenis_adjustableis true, and setsfinal_value = engine_value + adjustment_delta. FROM ( … ) srcwraps the CTEs so Coalesce can treat the query as a Join source.
-
On the Mapping tab, make sure the columns are mapped to the following:
src.kpi_id-STRINGsrc.period_month-BIGINTsrc.site_id-BIGINTsrc.site_name-STRINGsrc.engine_value-DECIMAL(18,2)src.adjustment_delta-DECIMAL(18,2)src.final_value-DECIMAL(18,2)
-
Click Create. Confirm the Node creates successfully.
-
Click Run. Confirm the run succeeds.
-
Open Preview and confirm
engine_value,adjustment_delta, andfinal_valuefor each KPI. Preview typically returns 100 sample rows. Where an adjustment matches an adjustable KPI,final_valuediffers fromengine_valueby that delta.
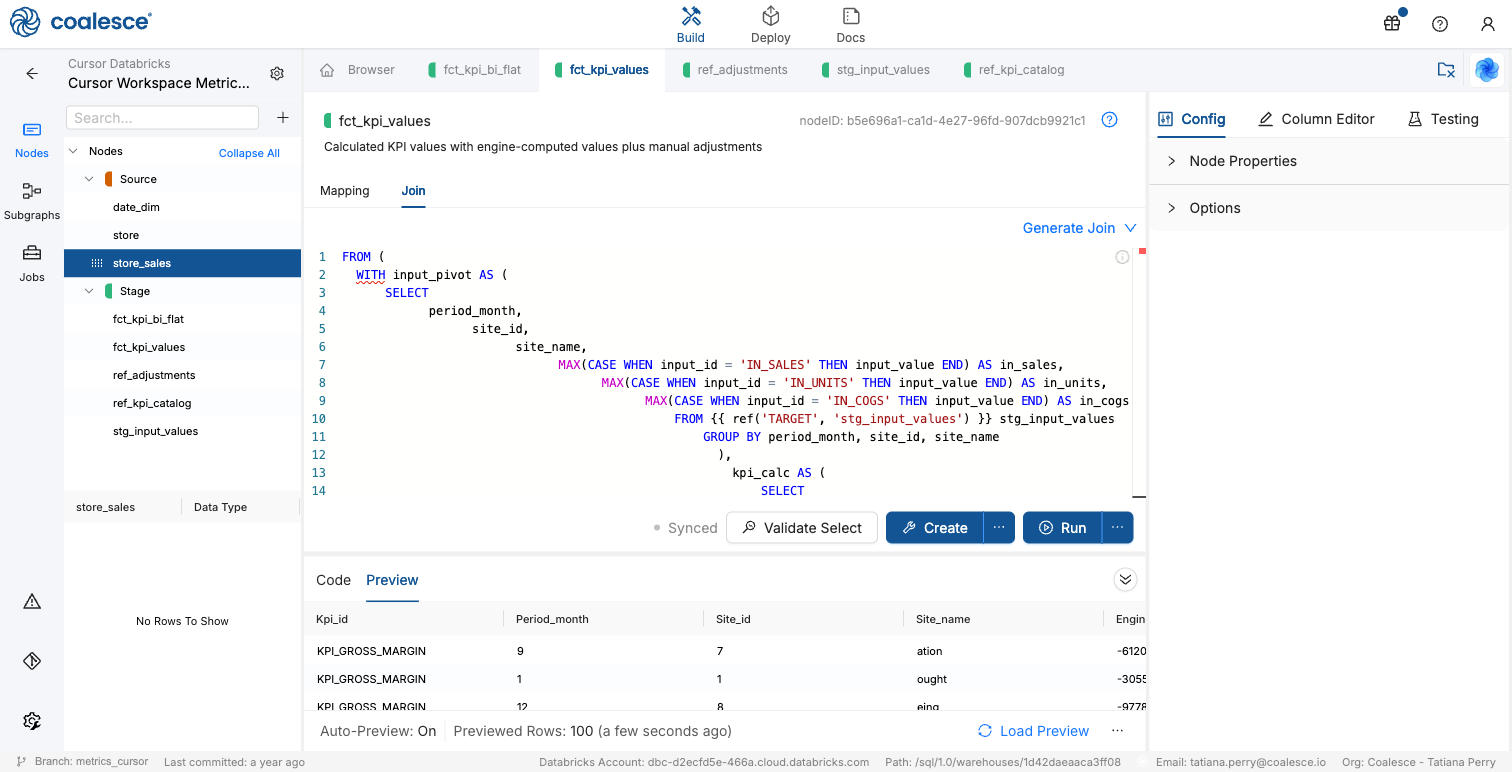
On the graph, fct_kpi_values should show parents stg_input_values, ref_kpi_catalog, and ref_adjustments.
Step 6: Present a Flat BI Table
Create a Stage Node that pivots long-form KPI finals into 1 wide row per site and month for BI.
-
In Browser, right-click
fct_kpi_valuesand select Add Node > Stage. -
Name the Node
fct_kpi_bi_flatand set its Storage Location to TARGET. -
Set the Node description to
Flattened BI-ready table with one column per KPI for reporting tools. -
On the Join tab, paste:
FROM {{ ref('TARGET', 'fct_kpi_values') }} fct_kpi_valuesGROUP BYperiod_month,site_id,site_nameWhat does
fct_kpi_bi_flatdo?This Join builds
fct_kpi_bi_flat: 1 wide row per site and month for BI consumption.- The Join reads
fct_kpi_valuesand groups byperiod_month,site_id, andsite_name. - Mapping transforms pivot each
kpi_idinto its own column withMAX(CASE WHEN … THEN final_value END).
- The Join reads
-
On the Mapping tab, define the grain columns and conditional aggregates:
Column Transform Type period_monthfct_kpi_values.period_monthBIGINTsite_idfct_kpi_values.site_idBIGINTsite_namefct_kpi_values.site_nameSTRINGkpi_gross_marginMAX(CASE WHEN fct_kpi_values.kpi_id = 'KPI_GROSS_MARGIN' THEN fct_kpi_values.final_value END)DECIMAL(18,2)kpi_aspMAX(CASE WHEN fct_kpi_values.kpi_id = 'KPI_ASP' THEN fct_kpi_values.final_value END)DECIMAL(18,2)kpi_margin_pctMAX(CASE WHEN fct_kpi_values.kpi_id = 'KPI_MARGIN_PCT' THEN fct_kpi_values.final_value END)DECIMAL(18,2)kpi_contributionMAX(CASE WHEN fct_kpi_values.kpi_id = 'KPI_CONTRIBUTION' THEN fct_kpi_values.final_value END)DECIMAL(18,2) -
Click Create. Confirm the Node creates successfully.
-
Click Run. Confirm the run succeeds.
-
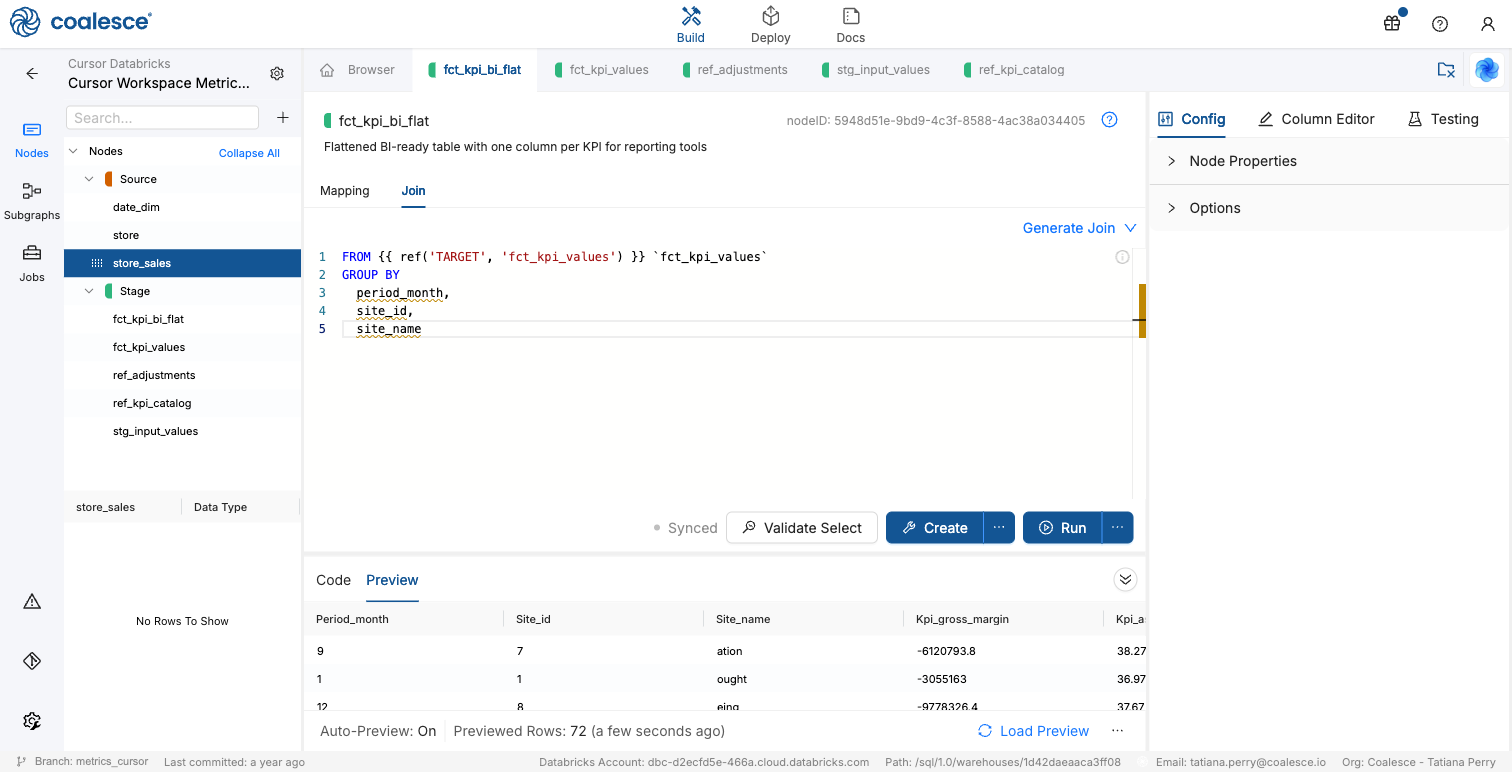
Open Preview and confirm the wide table. Previewed Rows should show 72 site-month combinations for year 2001 store sales in this example, with 1 column per KPI. That count is the distinct site and month pairs present in the filtered sales data, not every store key in TPC-DS.
What's Next?
- Review Databricks Connection Guide if teammates need the same warehouse setup.
- Explore Databricks & Coalesce: Build a Weather Analytics Pipeline for another Databricks Stage and Fact walkthrough.
- Read Using Incremental Nodes when input extracts should load only new periods.